

Prototype - Privacy Data Dashboard
My first project as a graduate research assistant was a survey based research study for CHI2022 which was titled ““It would probably turn into a social faux-pas”: Users’ and Bystanders’ Preferences of Privacy Awareness Mechanisms in Smart Homes”. It was a survey based study in which four privacy notifications were introduced to participants to study whether or not they alleviated users’ privacy concerns in various scenarios. Under the guidance of Professor Dr. Yaxing Yao, I got the opportunity to lead this project. I led this research by designing the survey which was inclusive of multiple scenarios to understand user perspective for different privacy awareness mechanisms. Along with this I also contributed towards qualitative coding, and paper writing. In conjunction with these tasks, I designed and prototyped a couple of privacy mechanisms. The ‘Privacy Data Dashboard’ was one of them.
The Challenge
The survey designed for the study was structured into three main sections. The first section had a set of general questions based on privacy in smart homes. The second section introduced participants to the notification mechanisms and the final section consisted of scenario based questions. The challenge was to design a mechanism which would be capable of overcoming the privacy concerns raised for participants, after answering the questions in the first section of the survey.
Understanding the User
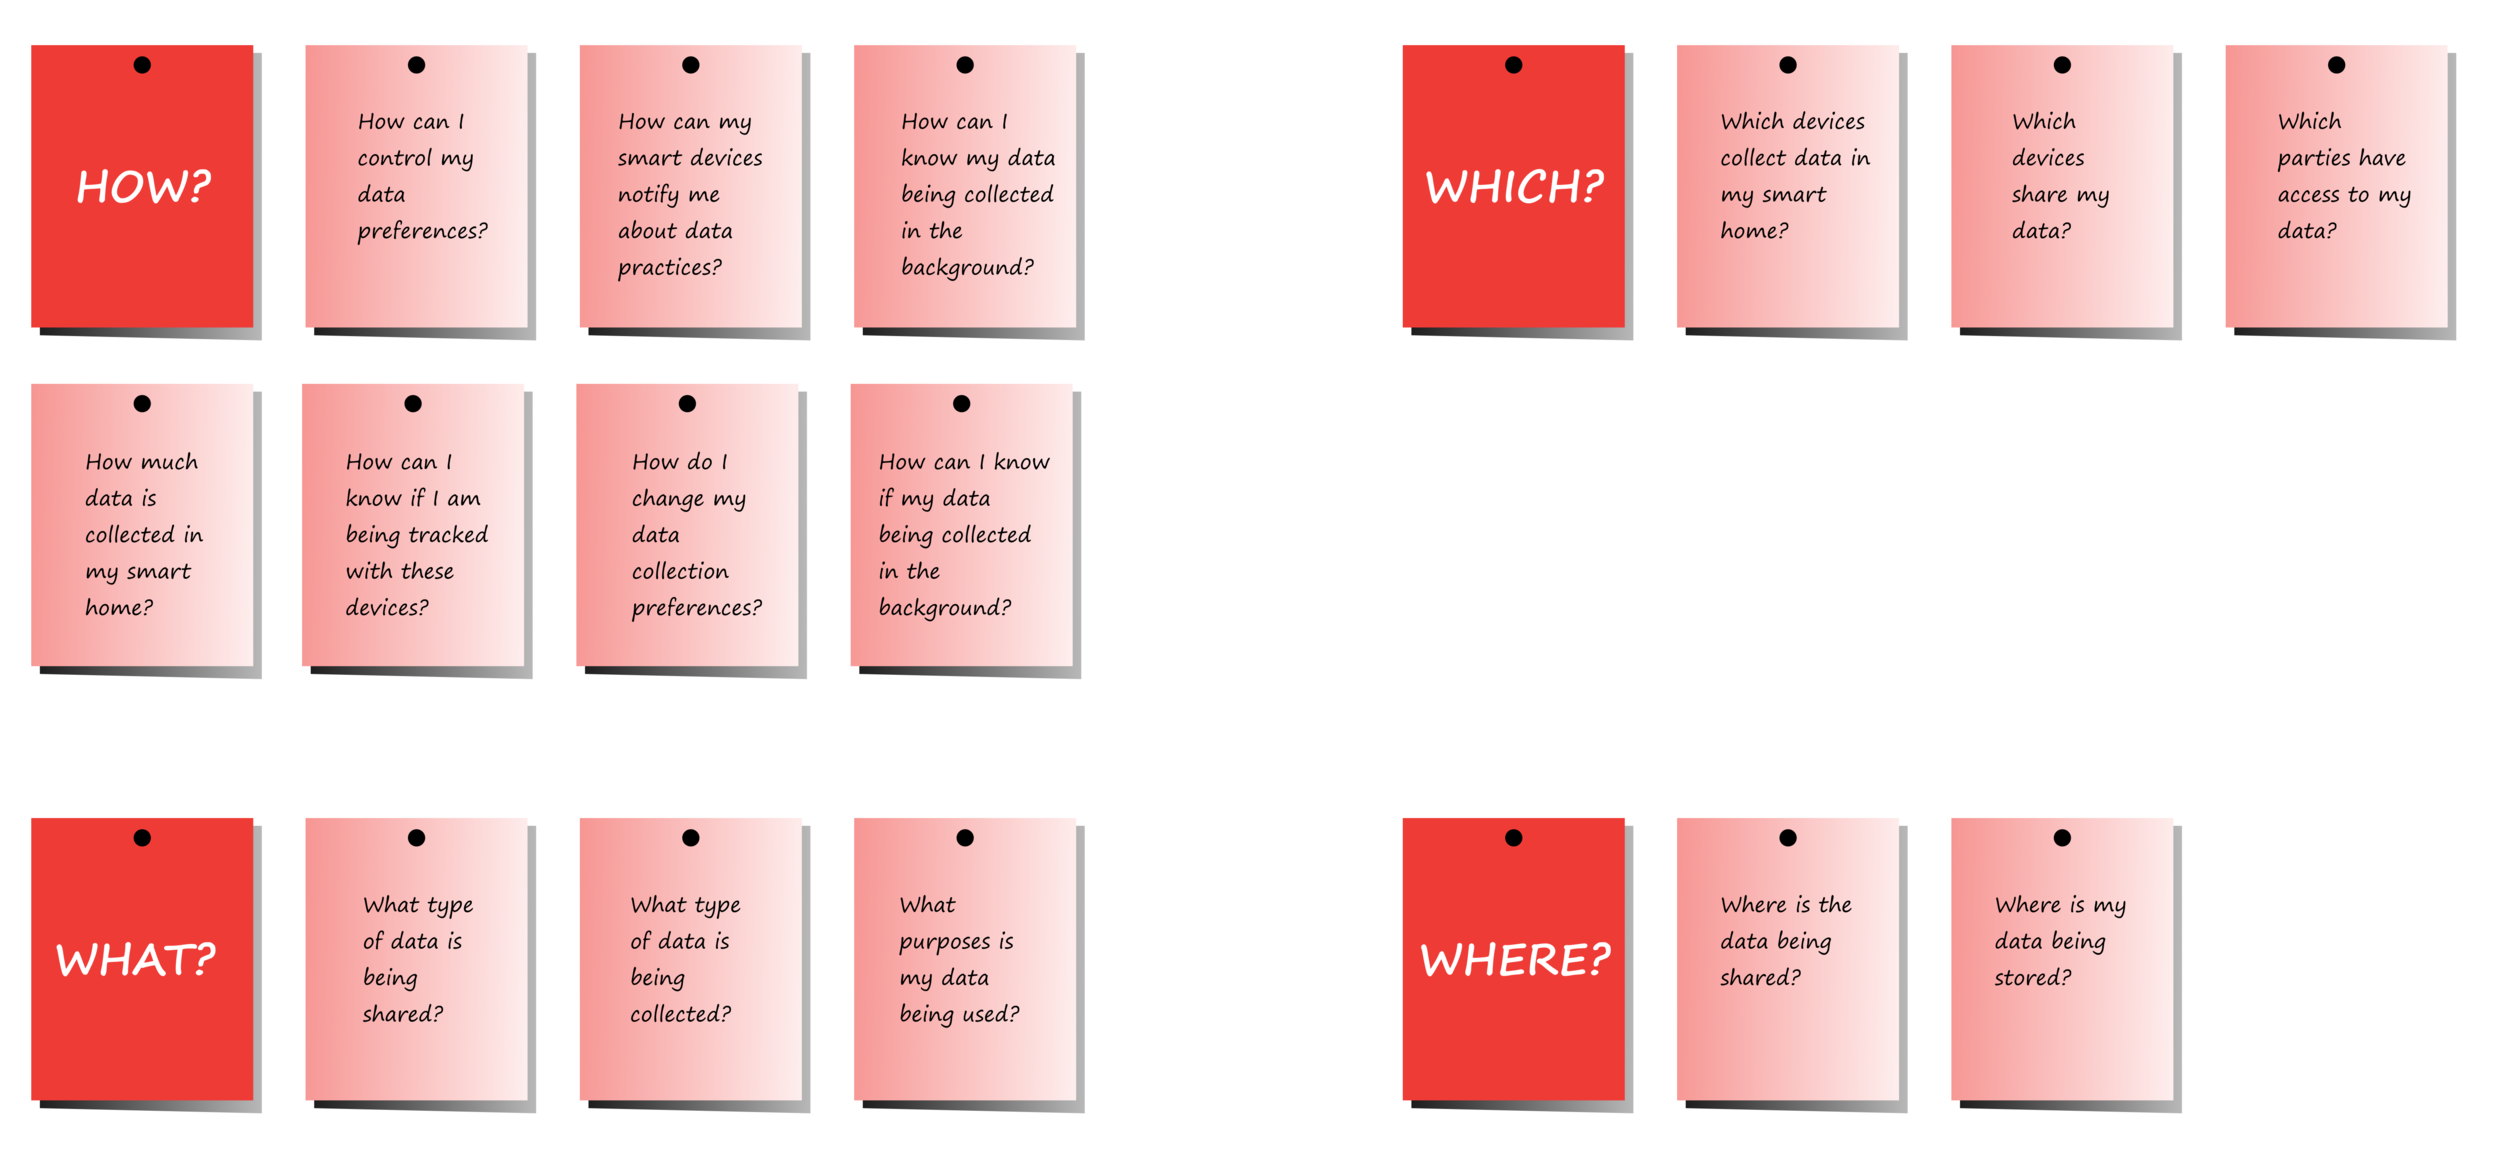
In order to overcome the privacy concerns which came to the user’s mind with the help of a mechanism. It was very crucial to understand what the participants would think of privacy and smart home devices. I created a question board with visual illustration and mapped all the possible questions which would come to the users and bystanders' minds. Studying literature in the space of privacy in smart homes helped me understand the need for privacy notifications in smart homes. This helped me derive the right questions!
Understanding the Data Space
Having a set of empirical concerns for privacy in smart homes the next step was to understand the smart devices and their data practices. This was crucial for me to determine the type of information to be included in the Data Dashboard. Studying the smart home devices and their behaviors resulted in a better understanding to present users and bystanders with effective privacy notifications. With the help of resources present on IoTPrivacy portal I came up with this illustration of cloud which helps in understanding the different which can be collected by smart devices present in a smart home environment.
Screen Selection and Wireframes
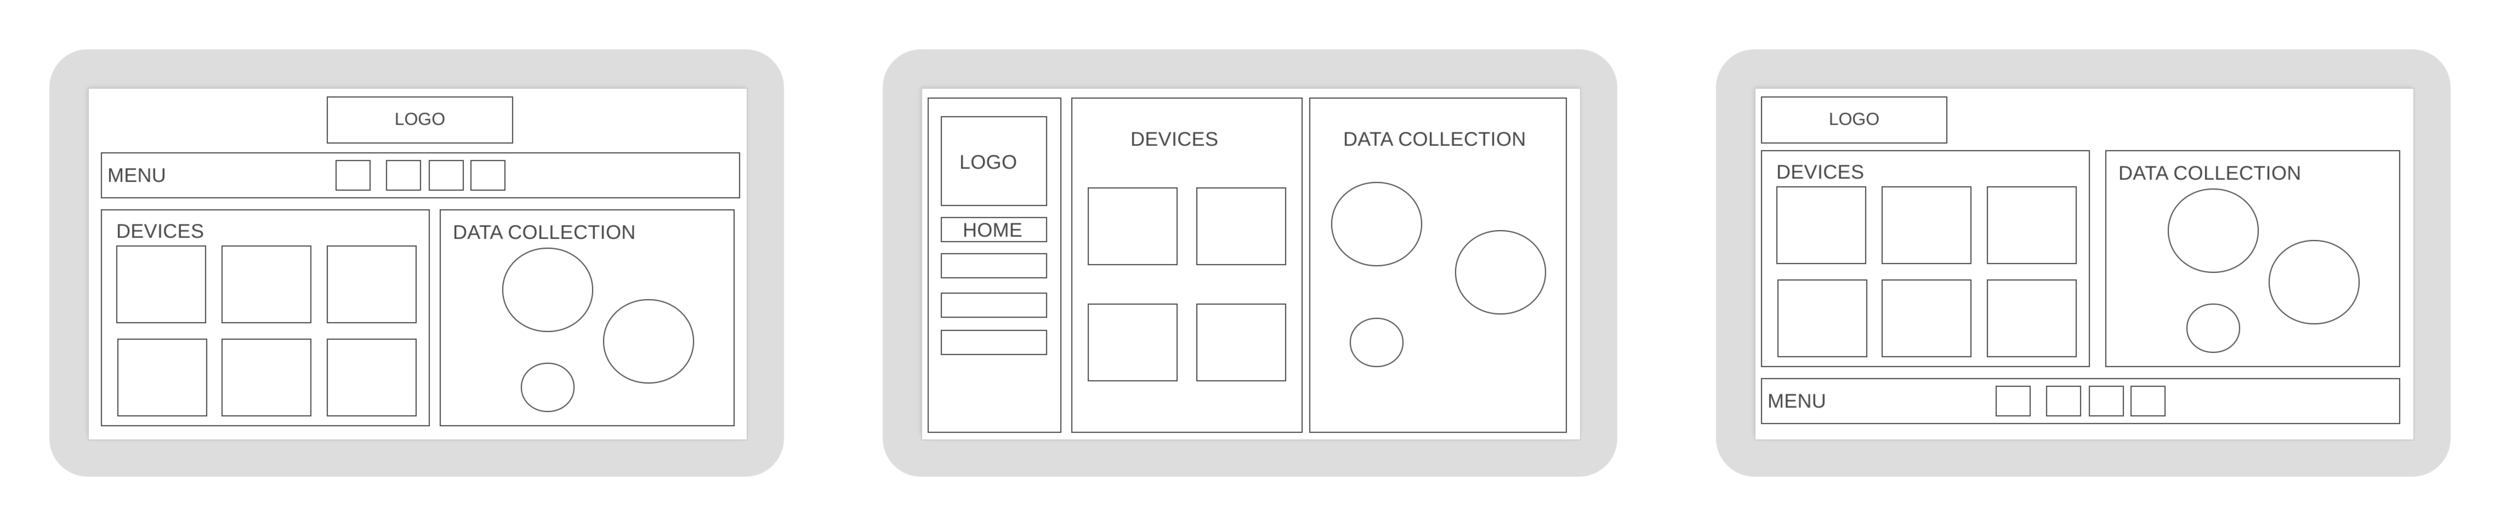
Next step in the process was to determine the screens for the dashboard. The vision was to have a simple interface which provides users effective notifications and insights about data privacy in smart homes without having deep technical knowledge. Based on the diversity of data available after the previous stage. The Dashboard was envisioned as a comprehensive device which holds information about multiple devices connected in a smart home. The following screens were decided upon analyzing the data pool as an attempt to elevate user privacy in smart homes with easy and effective notifications. To determine the interface architecture of the dashboard, I created wireframes alongside each of the selected screens.
Dashboard Home
The home screen was aimed to display key information about data practices in the smart home. Finalized sections for the home screen were the dashboard logo, navigation menu, overview of devices and data statistics.
Devices
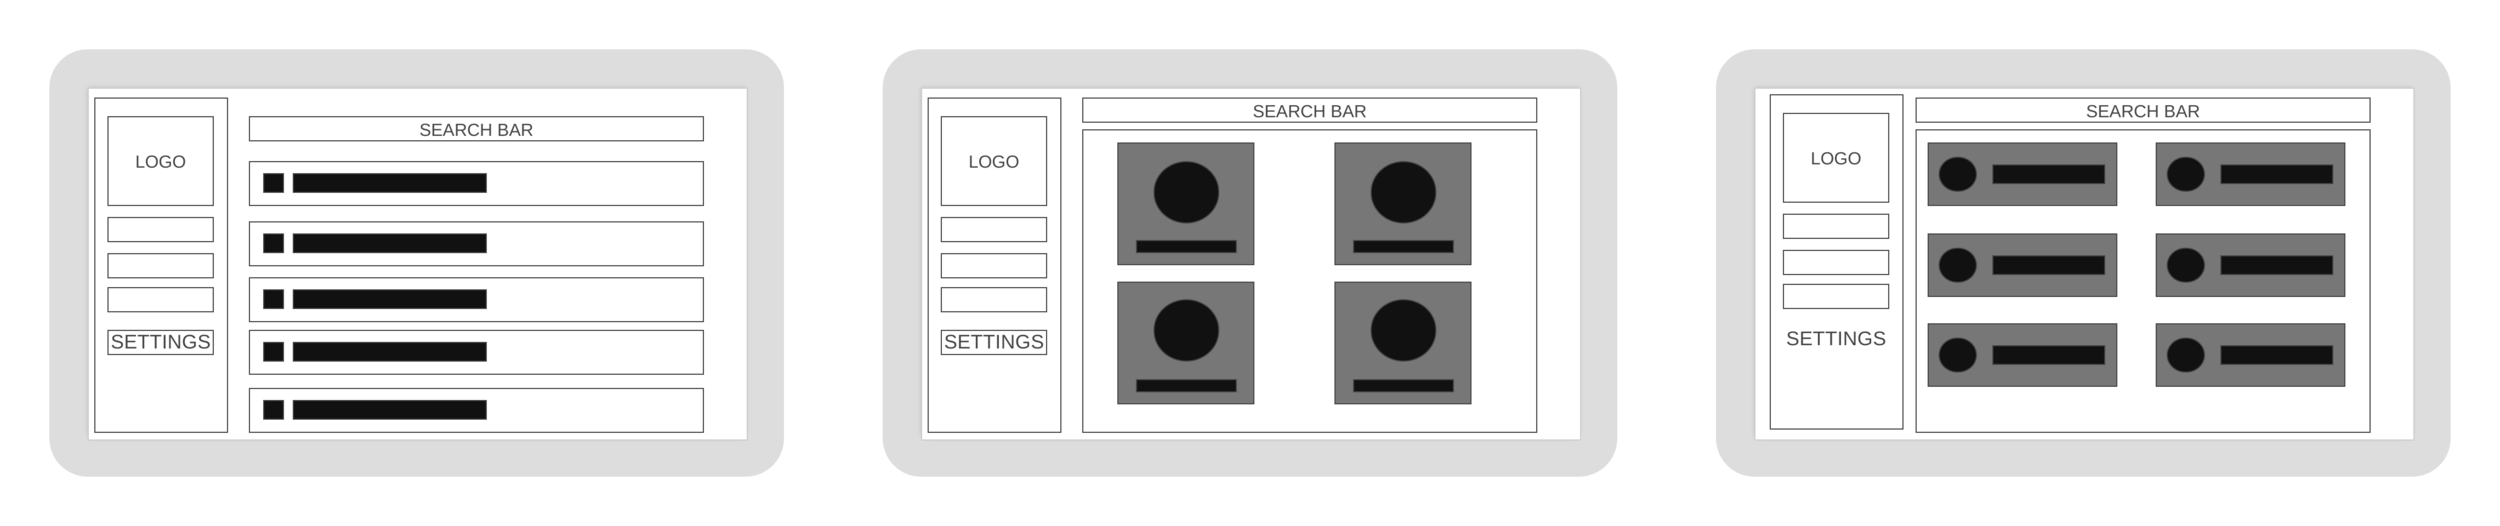
For users to access detailed information about each of the devices connected to their smart home, the devices section was included in the dashboard. This section would allow users to check status and provide controls to configure privacy settings for each device as per their needs.

Reports
For users to view and download reports for data sharing statistics from the devices connected in the smart home and view insights for data access for each of the companies, a dedicated reports section was included in the design. The reports section would help users breakdown and understand every detail of the information.

Settings
To give users the scope of personalizing the data dashboard according to their needs and cater preferences. A settings section was included for the dashboard prototype.
Final Prototype

Home

Devices

Reports

Settings

Notifications